
Last tested: November 21, 2026 · By Alex
The answer to why website is slow almost always comes down to one phase of the page load: the server takes too long to build the page, the bytes take too long to arrive, or the browser takes too long to turn them into something usable. Random speed tweaks rarely help, because each phase has different causes. The fastest way to a faster site is to measure where the time goes, fix the slowest phase, and measure again.
This guide is built around that idea. It shows how to confirm that real visitors see the slowness, how to split one page load into phases with the browser and with curl, and which fixes belong to each phase, with WordPress-specific checks where they matter. If pages do not just load slowly but fail with a timeout, start with 504 Gateway Timeout or, behind Cloudflare, Error 524.
Quick Checks
- Open the site in a private window on another network, for example mobile data. If it is only slow for you, the cause is local: VPN, proxy, antivirus or the connection.
- Check whether every page is slow or only some. Whole-site slowness points to the server or caching; single pages point to a template, an image, a plugin or a script.
- Measure the time to first byte:
curl -o /dev/null -s -w "TTFB: %{time_starttransfer}s\n" https://example.com/. Above about 0.8 seconds, the backend is part of the problem. - Run the page through PageSpeed Insights and look at both halves of the report: real-user data at the top, the lab test below.
- Think about what changed before it got slow: a plugin, a theme update, a hosting move, new tracking scripts or a traffic spike.
Field Data vs Lab Data: Confirm the Site Is Really Slow
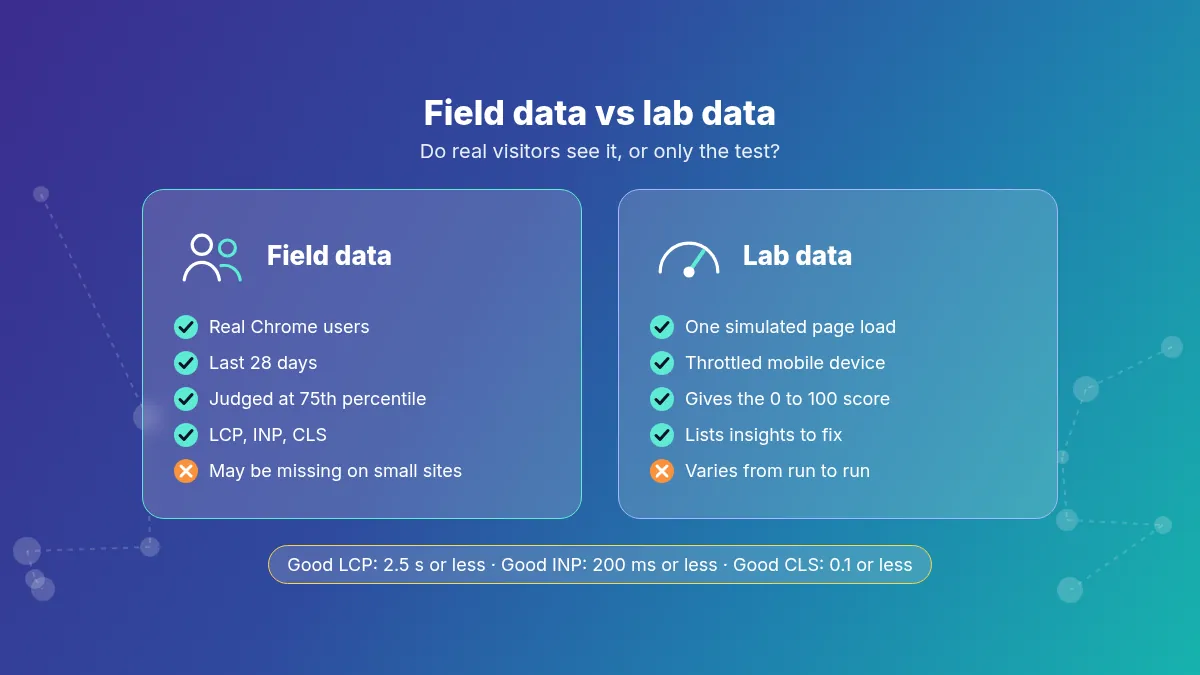
“Slow” can mean three different things: slow to start showing content, slow to react when someone taps or clicks, or content that jumps around while it loads. Google measures these as the Core Web Vitals, and its thresholds are a good definition of slow:
| Metric | What it measures | Good | Poor |
|---|---|---|---|
| Largest Contentful Paint (LCP) | When the main content, often a hero image or headline, has rendered | 2.5 s or less | Over 4 s |
| Interaction to Next Paint (INP) | How quickly the page responds to clicks, taps and key presses | 200 ms or less | Over 500 ms |
| Cumulative Layout Shift (CLS) | How much the layout moves while loading | 0.1 or less | Over 0.25 |
INP replaced First Input Delay as a Core Web Vital in March 2024, so older guides that talk about FID are out of date. Time to first byte is not a Core Web Vital, but web.dev treats 0.8 seconds or less as a good target because every later phase waits for it.
The two halves of a PageSpeed Insights report answer different questions. Field data at the top comes from real Chrome users over the last 28 days and is judged at the 75th percentile, so it tells you whether visitors actually have a problem. Lab data below is one simulated load on a throttled mobile device; it gives the 0 to 100 score and the list of issues, and it varies from run to run. A poor lab score with good field data is a low priority. Good lab results with poor field data usually mean the problem is on real devices, real networks or pages the test did not cover. Small sites may have no field data; then use the Core Web Vitals report in Google Search Console, which groups similar URLs, and your own repeated tests.
Where the Time Goes: Split the Load into Phases
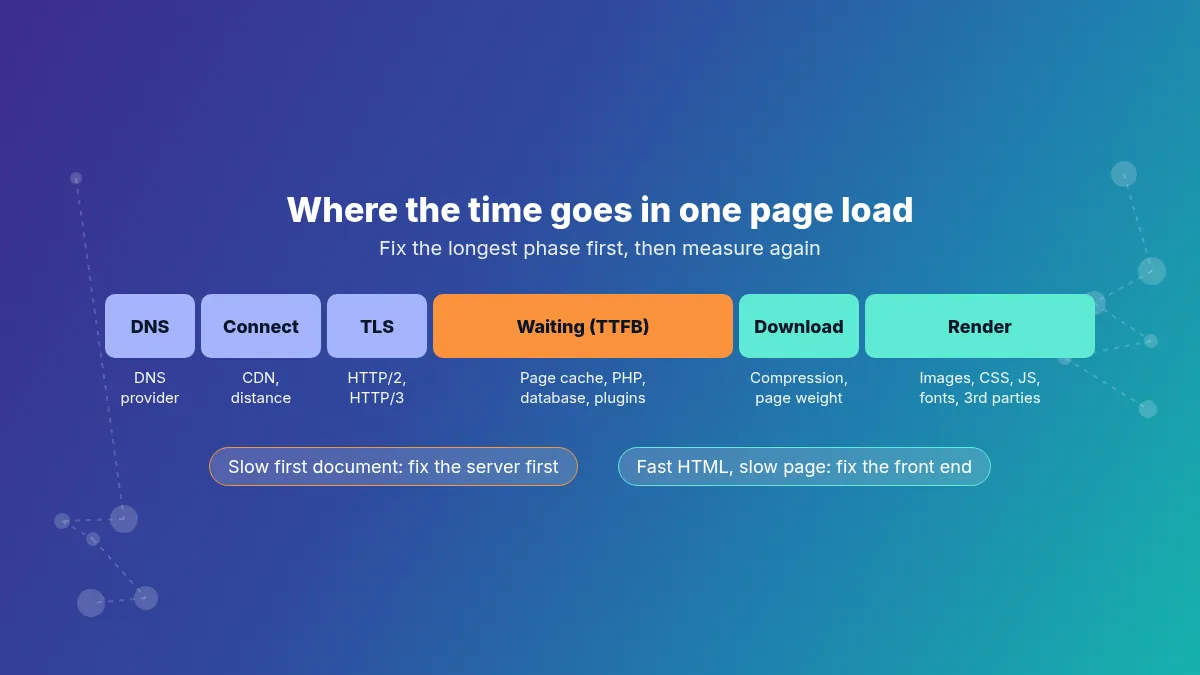
Every page load runs through the same sequence. The browser looks up the domain (DNS), opens a connection, negotiates TLS, sends the request and waits while the server builds the HTML, downloads it, and then fetches the CSS, JavaScript, fonts and images it needs to render the page. In Chrome DevTools, open the Network panel, reload, click the first document request and open the Timing tab: it shows DNS Lookup, Initial connection, SSL, Waiting for server response and Content Download for that request.
| Slow phase | Typical cause | Where to fix it |
|---|---|---|
| DNS lookup | Slow or distant DNS provider, long CNAME chains | DNS provider |
| Connect and TLS | Server far from visitors, no HTTP/2 or HTTP/3, no connection reuse | CDN, server config |
| Waiting for server response (TTFB) | No page cache, slow PHP or database, overloaded server, redirects | Caching, hosting, plugins |
| Content download | Large HTML, no compression, slow network | Compression, page weight |
| Rendering | Heavy images, render-blocking CSS and JavaScript, fonts, third-party scripts | Theme, plugins, front-end code |
The rule that saves the most time: if the first document is slow, fix the server first. No amount of image compression helps when the HTML takes two seconds to arrive. If the HTML arrives quickly and the page is still slow, the problem is in the front end.
Slow Server Response: Measure and Fix TTFB
Measure It from the Command Line
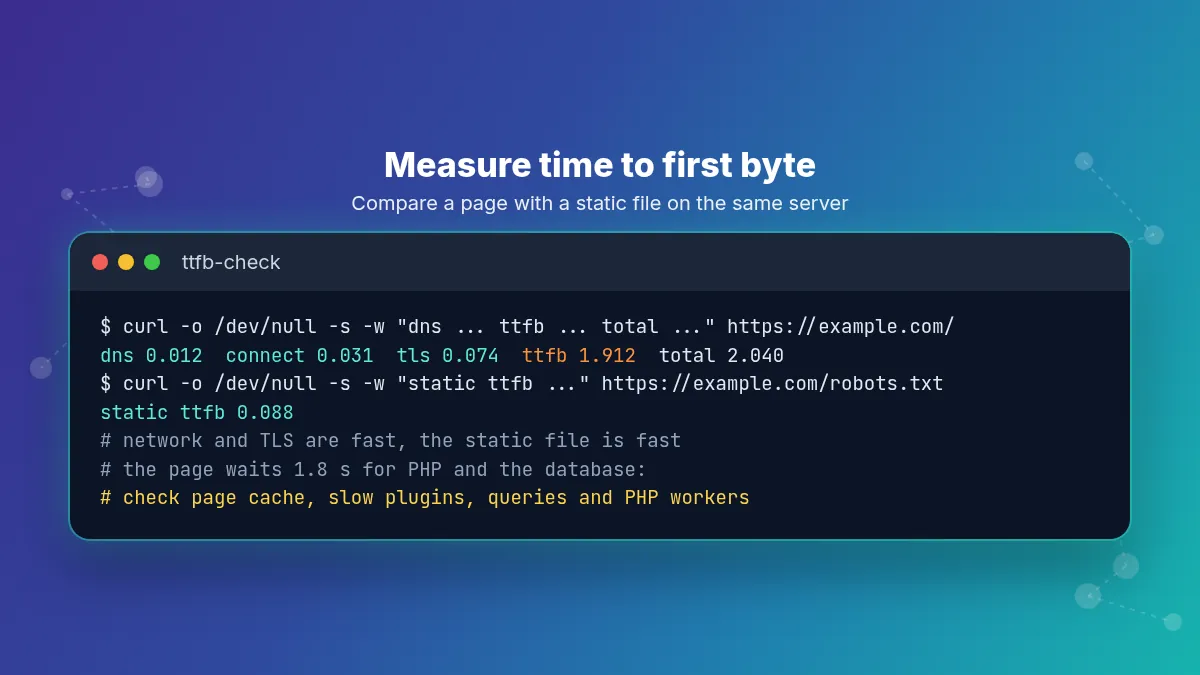
curl -o /dev/null -s -w "dns %{time_namelookup}  connect %{time_connect}  tls %{time_appconnect}  ttfb %{time_starttransfer}  total %{time_total}\n" https://example.com/
curl -o /dev/null -s -w "static ttfb %{time_starttransfer}\n" https://example.com/robots.txt
The values are cumulative seconds from the start of the request. Subtract the TLS time from the TTFB to get the time the server spent on the request. If the page takes 1.5 seconds and a static file such as robots.txt takes 0.1, the web server and network are fine and the delay is in generating the page: PHP, the database, plugins or a missing cache. Run each command a few times, because the first request after a cache purge is always slower.
Check That Pages Come from Cache
curl -sI https://example.com/ | grep -iE "x-litespeed-cache|x-cache|cf-cache-status|cache-control|age"Request the page twice. A miss, BYPASS or no cache header at all on the second request means every visitor waits for PHP. Turn on page caching in your caching plugin or server (LiteSpeed Cache on LiteSpeed servers, FastCGI cache on Nginx) and look for plugins that set cookies or Cache-Control: private or no-cache on public pages, which make the cache step aside. Logged-in users, carts and checkout are normally not cached, so test those separately.
Server Resources and PHP Workers
uptime
free -m
vmstat 1 5
sudo grep -i "max_children" /var/log/php*-fpm.log
The server is the bottleneck if the load average stays above the number of CPU cores (nproc), free memory is near zero with swap in use, the wa column in vmstat is consistently high, or the PHP-FPM log shows server reached pm.max_children. On shared hosting, look for CPU, entry process or I/O limits in the resource usage page. Reschedule heavy backups and cron jobs, raise pm.max_children only as far as RAM allows, and upgrade the plan if the server is simply too small. When PHP runs out of memory instead, you see a memory exhausted error rather than slowness.
Also check the PHP version. PHP 8.1 and older no longer receive security fixes, and PHP 8.2 reaches its end of life on December 31, 2026. Newer versions are usually faster for WordPress, and OPcache should be enabled on any production server.
Database and Autoloaded Options
In WordPress, install Query Monitor and load a slow page while logged in. It shows total query time, the slowest queries and the plugin behind each one. Since WordPress 6.6, Tools → Site Health also warns when autoloaded options, which load on every request, exceed 800 KB. To find the largest ones:
wp db query "SELECT option_name, LENGTH(option_value) AS bytes, autoload FROM wp_options WHERE autoload IN ('yes','on','auto-on','auto') ORDER BY bytes DESC LIMIT 15;"WordPress 6.6 added the values on, auto-on and auto next to the old yes, so older queries that only check yes miss part of the data. Adjust wp_ if your table prefix differs. Remove options left by deleted plugins, clear expired transients with wp transient delete --expired, and replace the plugin behind slow queries. A persistent object cache such as Redis helps sites with many dynamic or logged-in requests. If the database is not just slow but unreachable, see error establishing a database connection.
Plugins and Themes
Page builders, search and filter plugins, related-post widgets and security suites can add queries, external API calls and large asset bundles. Query Monitor shows time per plugin. On a staging copy, deactivate suspects one at a time (wp plugin deactivate plugin-slug) and repeat the TTFB measurement after each change. Keep the plugin that matters and replace or reconfigure the one that adds the most time.
Slow Delivery: Redirects, Distance and Compression
Redirect Chains
curl -sIL http://example.com/old-page | grep -iE "^HTTP|^location"Each redirect costs a full round trip before the real page starts. More than one 301 or 302 before the final 200 is a chain: point old URLs straight at the final HTTPS address and update internal links. Redirects that never end are a different problem, covered in ERR_TOO_MANY_REDIRECTS.
Distance and the CDN
When connect and TLS times are high from distant locations while server time stays low, the content travels too far. A CDN serves static files, and cached HTML if configured, from locations near visitors. If most visitors are in one country, hosting the server there helps as much as any plugin.
Compression and Protocol
curl -sI -H "Accept-Encoding: br, gzip" https://example.com/ | grep -iE "content-encoding|alt-svc"
curl -s -o /dev/null -w "%{http_version}\n" https://example.com/
HTML, CSS and JavaScript should come back with content-encoding: br or gzip. The second command prints 2 for HTTP/2; an alt-svc header with h3 means HTTP/3 is offered. A site still on HTTP/1.1 with no compression downloads much more slowly on mobile networks.
Slow Rendering: Images, Scripts and Fonts
The LCP Image
On most pages the largest element is a hero or featured image. Serve it at the size it is displayed, in WebP or AVIF, and never lazy-load it. WordPress 6.3 and later add fetchpriority="high" to the image it expects to be the LCP element and skip lazy loading for it, but sliders, page builders and lazy-load plugins can undo that. In DevTools, filter the Network panel by Img and sort by size to find images of several hundred kilobytes shown in small columns.
CSS and JavaScript
Large stylesheets and synchronous scripts in the page head block rendering until they are downloaded. Defer non-critical JavaScript, remove unused CSS, and load plugin assets only on the pages that need them. Caching plugins offer these options, but aggressive deferral can break menus, forms and checkout, so test after each change. Heavy JavaScript is also the main cause of poor INP: long tasks on the main thread delay every click.
Third-Party Scripts
Chat widgets, ad code, heatmaps, tag managers, social embeds and A/B testing tools run code you do not control. In DevTools, right-click one of their requests, choose Block request domain and reload. If the page gets clearly faster, remove the script, load it only where needed or delay it until user interaction.
Fonts and Layout Shifts
Self-host the few font weights you use, preload the main one and use font-display: swap. Give images, embeds and ads fixed dimensions so the layout does not jump when they arrive.
Reading PageSpeed Insights in 2026
Lighthouse 13, released in October 2025, replaced the old opportunity audits with insights, so many familiar names are gone from PageSpeed Insights. The score is still calculated the same way. The renames you are most likely to need:
- Eliminate render-blocking resources is now Render blocking requests.
- Properly size images, Serve images in next-gen formats and Efficiently encode images are combined into Improve image delivery.
- Reduce server response times, Enable text compression and Avoid multiple page redirects are part of Document request latency.
- Reduce the impact of third-party code is now 3rd parties, and the static asset cache audit is Use efficient cache lifetimes.
Open the LCP breakdown insight first. It splits the LCP time into time to first byte, load delay, load time and render delay, which maps directly onto the phases above and tells you whether to work on the server, the image or the front-end code.
Slow Only Sometimes: Peaks, Logged-In Users and Background Jobs
- Slow at busy hours. Compare TTFB at quiet and busy times. Worker exhaustion during peaks ends in 502 Bad Gateway, 503 Service Unavailable or 504 errors. Raise the cache hit ratio first so fewer requests reach PHP, then add capacity.
- Slow only when logged in. Logged-in pages bypass the page cache. Check admin plugins in Query Monitor and the Heartbeat API, which sends
admin-ajax.phprequests every 15 to 60 seconds from open admin tabs. - Slow at fixed times. Backups, imports and WP-Cron jobs that run on page loads compete with visitors. Move WP-Cron to a real server cron job; if scheduled tasks then stop running, see WordPress missed schedule.
- Slow because of bots. Aggressive crawlers, scrapers and AI bots can use more PHP workers than real visitors. Check the access log for the top user agents and IPs and rate-limit the worst ones (see 429 Too Many Requests).
- Slow for one person or region only. Compare with why a website is down for me but not for others; DNS, ISP routing or a local network can be the cause.
Fix Order: What to Do First
- Confirm the problem in field data or with repeated tests from more than one network.
- Measure TTFB for a page and a static file. If the page is slow, fix caching, then the slowest plugin or query, then server resources.
- Remove redirect chains and turn on compression and HTTP/2 or HTTP/3.
- Fix the LCP element: image size, format and priority.
- Cut render-blocking CSS and JavaScript and remove or delay third-party scripts.
- Retest the same pages under the same conditions after each change, and keep notes of what helped.
Prevention Tips
- Check new plugins and themes on staging and measure TTFB and page weight before and after.
- Compress and resize images before upload, or let an optimization plugin do it automatically.
- Review third-party scripts every few months and remove the ones nobody uses.
- Watch server resources and the Core Web Vitals report in Search Console, not only lab scores.
- Keep PHP, WordPress and the caching plugin up to date.
If the site does not load at all rather than loading slowly, go to why a website is not loading; for other errors, start from how to fix website errors.
When to Contact Support
Contact your hosting provider if TTFB is high even for cached pages and static files, CPU, memory or PHP workers are maxed out under normal traffic, or you need logs and settings you cannot reach. Contact your developer or the plugin author if the slowdown started after a code or plugin change, or one feature or template is much slower than the rest. Stay with local troubleshooting if the site is slow on only one device or network. Send the curl timings, the PageSpeed Insights link, the slow URLs and the time of day the problem appears.
Frequently Asked Questions
Usually one phase of the page load is slow: the server builds the page slowly because there is no cache or a heavy plugin, the files travel too far or uncompressed, or large images and scripts delay rendering. Measure first.
Measure the time to first byte with curl for a page and for a static file such as robots.txt. If the page takes much longer than the static file, the delay is in PHP, the database or a missing page cache.
web.dev treats 0.8 seconds or less as good. Cached pages on a healthy server often answer much faster. A TTFB of several seconds points to the server, not to images or scripts.
Mobile devices have slower processors and networks, so heavy JavaScript, large images, fonts and third-party scripts hurt more. PageSpeed Insights also tests mobile on a throttled device.
Common causes are a missing page cache, heavy plugins or page builders, large autoloaded options, slow hosting or too few PHP workers, oversized images and third-party scripts. Query Monitor shows the slowest parts.
Lighthouse 13 renamed and merged its audits into insights in October 2025. Look for Render blocking requests, Improve image delivery and Document request latency instead.

Hi, I’m Alex — the person behind ErrorRescue.
I’ve been working with websites, servers, and hosting for over 8 years. Most of my experience comes from troubleshooting real problems on WordPress sites, VPS and shared hosting environments, and Cloudflare setups. I’ve dealt with everything from SSL certificate failures and DNS misconfigurations to 504 timeouts, memory exhaustion errors, and Cloudflare 5xx issues.
I started ErrorRescue because I got tired of seeing generic, outdated, or incomplete error guides. My goal is to write clear, practical fixes based on what actually works in production — not just theory. Every guide here is tested against common server setups (Apache, NGINX, Cloudflare, and popular WordPress stacks).
When I’m not fixing sites, I’m usually reviewing new hosting configurations or updating existing guides so they stay accurate.